I Built a Clojure That Runs on Go(cljgo) . Then I Made It Run a Real AI Agent.

How dogfooding cljgo with a seven-language agent library turned into a Clojure port with zero reader conditionals — and a portability seam called koine that keeps the ugly parts somewhere else.
Building a language host(cljgo) is easy to fool yourself about. It runs your test suite, it runs your toy programs, and you conclude it works. So I went looking for something big enough to actually hurt.
I already had one: toolnexus, a library I maintain that gives any LLM real tool-calling — MCP servers, agent skills, your own functions, sub-agents — already ported across six languages (JavaScript, Python, Go, Java, C#, Elixir), all pinned to one behavioral contract. Porting it to Clojure would give Clojure developers something they didn’t have. Running that same port on cljgo would tell me whether cljgo is real.
The rule that made it interesting: no reader conditionals
The obvious way to write code for two hosts is #?(:clj ... :cljgo ...) sprinkled wherever they differ. I refused to do that, for a selfish reason and a principled one.
The selfish one: every conditional is a place where the two hosts can silently drift apart, and drift is precisely the bug this project exists to prevent.
The principled one: toolnexus should not know cljgo exists. A library about LLM tool-calling has no business containing opinions about which Clojure you run. If it does, then every future host — Babashka, ClojureCLR, whatever comes next — means editing the library.
So the host differences went somewhere else: koine, a small portability seam. File I/O, subprocesses, HTTP, JSON, environment, time, string handling above the BMP — anything the two hosts disagree about lives there and nowhere else. koine is where the conditionals go; toolnexus stays pure Clojure.
The result is one source tree with zero reader conditionals, verified in five execution modes — JVM main, JVM REPL, cljgo AOT, cljgo interpreted, cljgo REPL — with a CI gate that fails if the five disagree by a single assertion. Currently 395 tests, 1,614 assertions, five identical verdicts.
That means the whole dependency story for a Clojure developer is one line:
;; deps.edn — koine comes along with it
{:deps {net.clojars.muthuishere/toolnexus {:mvn/version "0.13.0"}}}
Any Clojure developer can use this and never think about cljgo. And the one cljgo developer — me, so far — gets the same library, unmodified. That’s the arrangement I wanted.
So what is toolnexus?
It is not a framework, and there is no runtime to deploy. It is a library built on one observation:
An MCP server tool, an agent skill, a function you wrote, an HTTP endpoint, a shell command, and a remote agent are the same thing to an LLM — a named, described, schema’d callable.
toolnexus unifies all of those behind one Tool interface, emits the schema in OpenAI / Anthropic / Gemini formats, and ships a client with the tool-calling loop already written: parallel and chained calls, hooks, retries, conversation memory, human-in-the-loop suspension, observability.
Concretely, you get:
- an MCP host — point it at an mcp.json and every server's tools (stdio and streamable-HTTP) join your registry
- agent skills — the open SKILL.md standard, loaded on demand rather than stuffed into the prompt
- your own functions, HTTP endpoints, and ten built-in tools (bash, read, write, edit, grep, glob…)
- sub-agents with scoped tool views and hard budgets, and remote A2A agents
All seven ports run the same examples/ fixtures and must produce the same behavior. The Clojure port is held to the same full conformance tier as the other six — it is not the junior member.
Enough architecture. Here is the thing running.
One agent, three tool sources, your terminal
Let’s build the thing every framework promises and rarely shows: an interactive agent you keep asking questions, backed by three different tool sources at once —
- an HTTP tool — one declaration that fetches the official Clojure events page
- an MCP server — @modelcontextprotocol/server-filesystem, spawned over stdio; all fourteen of its tools join the registry automatically
- an agent skill — a SKILL.md telling the model how to report events, loaded on demand
(Skills are the open SKILL.md standard — markdown instructions the model loads when the task matches. The catalog goes into the system prompt; the full text loads only on request. Progressive disclosure, not prompt stuffing.)
The skill — skills/clojure-events/SKILL.md:
---
name: clojure-events
description: Use when asked about Clojure community events, meetups or conferences. How to fetch and report them.
---
# How to report Clojure events
1. Fetch the official events page with your `clojure-events-page` tool — never
   answer from memory, events go stale.
2. List each event you find as: **name** — date — location (or "online").
3. Only report events that are actually on the page. If the page lists none,
   say so.
4. Close with the source link: https://clojure.org/community/events
5. Keep it a plain list, no marketing tone.
The program — src/chat.cljc, the whole thing:
(ns chat
  (:require [clojure.string :as str]
            [koine.env :as env]
            [koine.json :as json]
            [toolnexus.core :as tn]
            [toolnexus.client :as client]
            [toolnexus.http :as http]))
(def events-page
  (http/http-tool
   {:name        "clojure-events-page"
    :description "Fetches the official Clojure community events page and returns it as text."
    :method      :get
    :url         "https://clojure.org/community/events"
    :result-mode "text"}))
(def mcp-config
  {:mcpServers
   {:files {:type    "local"
            :command ["npx" "-y" "@modelcontextprotocol/server-filesystem" "."]
            :timeout 30000}}})
(defn -main [& _]
  (let [tk (tn/build {:skills   "skills"
                      :builtins false
                      :mcp      mcp-config
                      :tools    [events-page]})
        c  (client/create-client
            {:base-url "https://openrouter.ai/api/v1"
             :style    "openai"
             :model    (or (env/get-env "TN_MODEL") "openai/gpt-4o-mini")
             :api-key  (env/get-env "OPENROUTER_API_KEY")})]
    (loop []
      (print "you> ") (flush)
      (let [line (read-line)]
        (cond
          (or (nil? line) (#{"exit" "quit"} (str/trim line)))
          (do (println "bye.") (tn/shutdown! tk))
           (str/blank? line) (recur)
          :else
          (let [r (client/ask c line {:toolkit tk :id "cli" :on-event trace})]
            (println (str "agent> " (:text r)))
            (recur)))))))
Note client/ask with an :id — that is conversation memory. Every question you type continues the same conversation, so follow-ups like "which of those is soonest?" just work.
Run it:
$ cd clojure/examples && task clj-ex1
It greets you with the full inventory — one HTTP tool, fourteen files_* MCP tools, the skill loader, the clojure-events skill — suggests a few questions, and waits at you>.
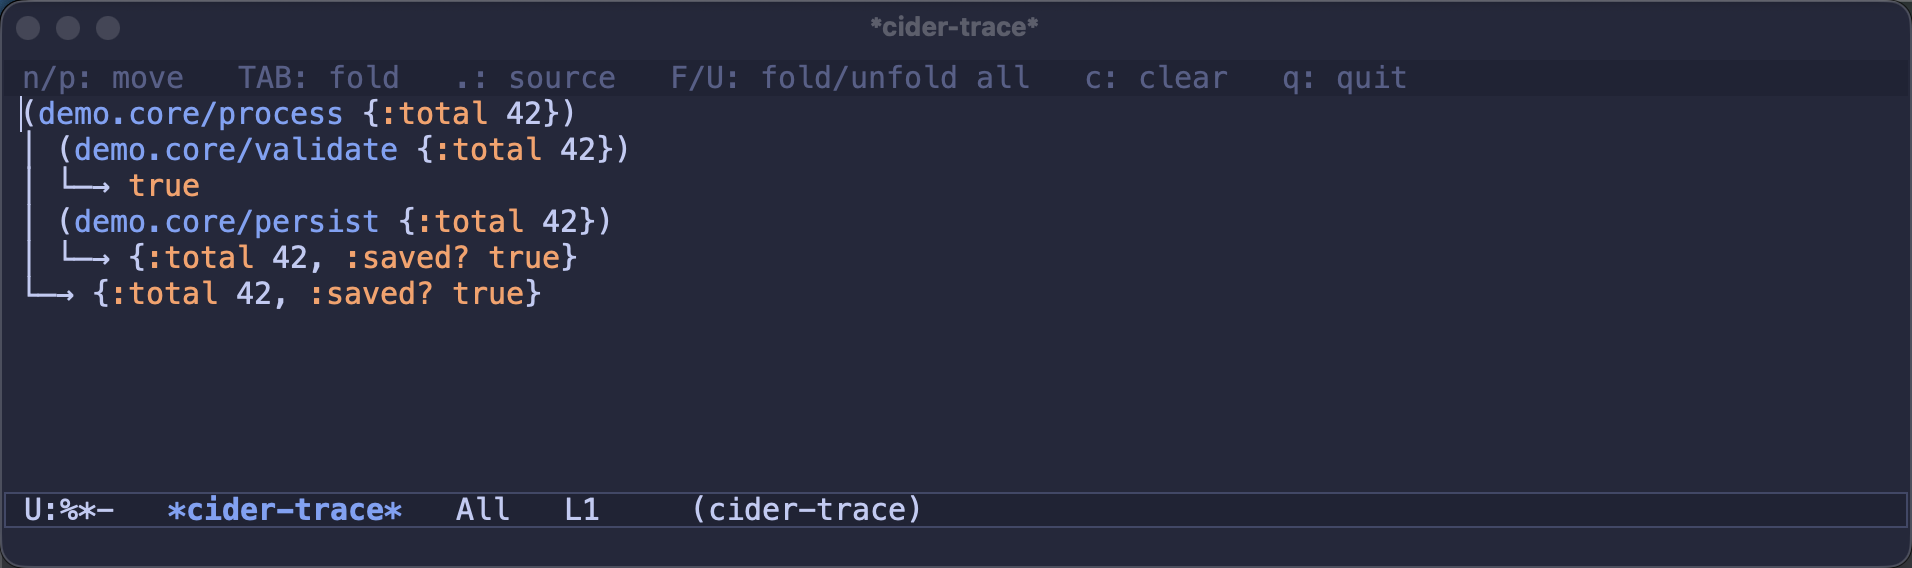
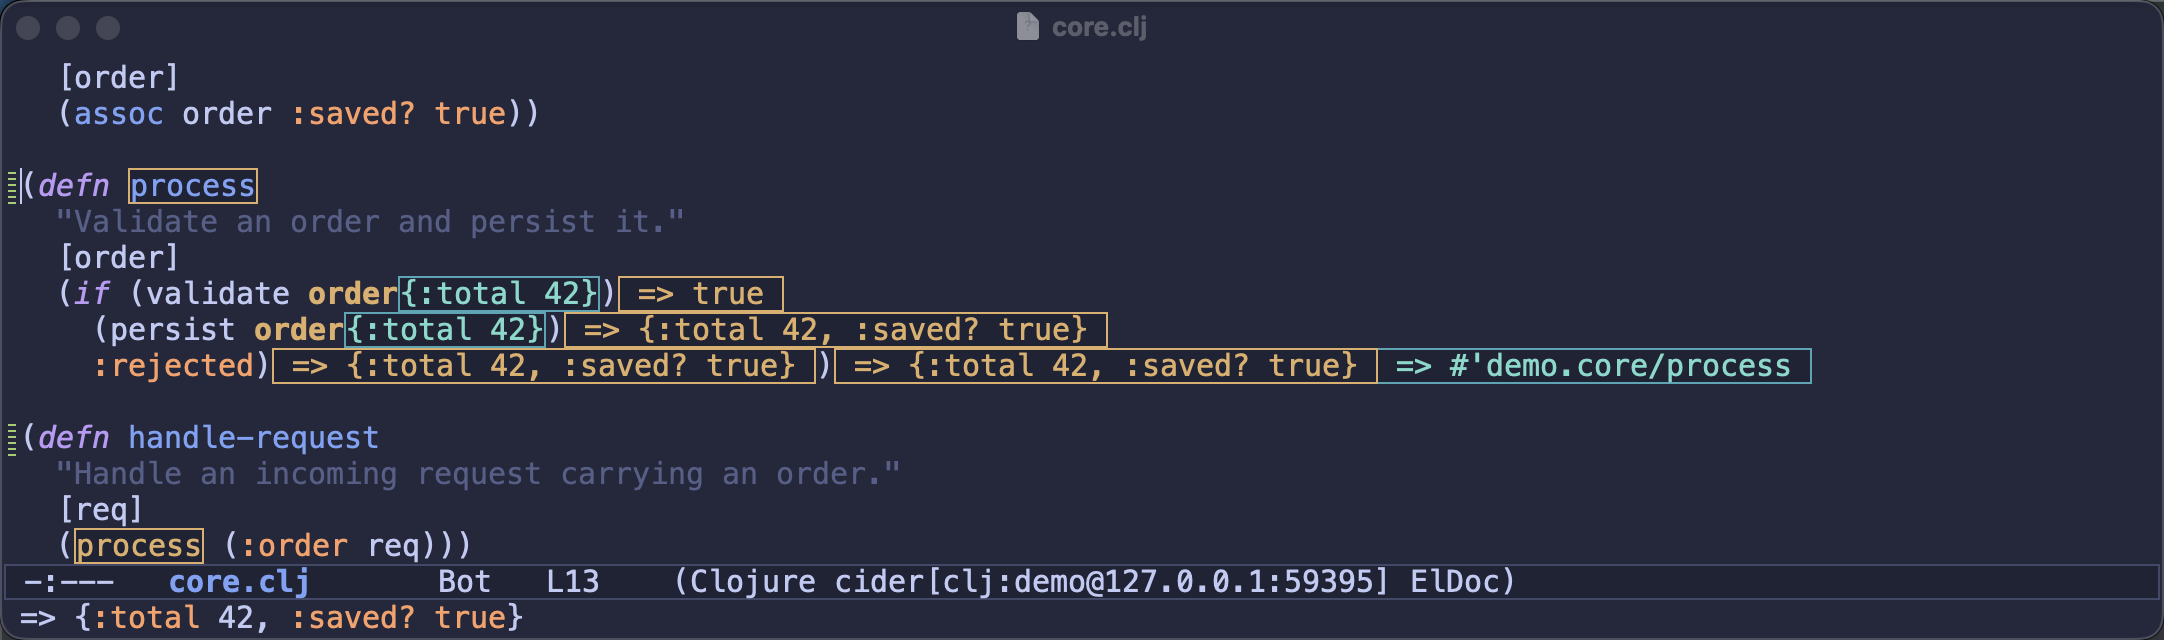
Recorded with vhs, unedited.
The same file on cljgo — no build step
$ task cljgo-ex1
That runs the same chat.cljc through cljgo run — Clojure hosted on Go, interpreted directly, no JVM anywhere. The startup banner is worth reading once: cljgo prints net.clojars.muthuishere/toolnexus 0.13.0 — 16 namespace(s) with no Java interop and notes it pruned org.clojure/clojure ("cljgo IS the Clojure implementation") — that is the static no-interop check happening for real, on the same artifact from Clojars. If you want the 20 ms cold start, cljgo build will also AOT it to a self-contained native binary — but nothing here requires it.
A real session on cljgo, unedited:

Both projects ship in the repo under clojure/examples (clj-ex1 and cljgo-ex1) with the Taskfile; MODEL= overrides the OpenRouter model per run.
The parts the example didn’t show
The demo used three tool sources. The rest of the library is there too, in all seven ports, because parity is the product:
- Sub-agents — an agent is a tool: a registry of agents with scoped toolkit views, teams, and hierarchical budgets (:max-tokens, :max-turns, :max-wall-ms…) that stop loudly, never silently
- Personas — from-dir composes an identity from files (SOUL.md, MEMORY.md…); a memory tool lets an agent edit its own durable notes; start-agent gives it a heartbeat
- Human in the loop — a tool can suspend with a question; the run comes back pending and resumes when your host answers. MCP servers that elicit input mid-call are bridged onto the same mechanism
- Compaction — a :before-llm hook that keeps a long-lived agent inside its context window
- Remote agents — expose your toolkit as an A2A agent with serve, or consume someone else's; either way it is just more tools
- Built-in tools — bash, read, write, edit, grep, glob and friends, with per-tool toggles
The honest numbers
We benchmarked all seven ports plus a dozen competitor frameworks on one machine in one sitting, and published the table as measured. The Clojure port is currently the slowest port over MCP — ~5.5 ms p50 per request against Go’s 0.49 — and we know exactly why: ~2 ms per stdio round-trip in the JSON-RPC path, already logged as the top optimization target. With native tools it runs the same scenario in 1.7 ms, mid-table, ahead of LangChain.js and Mastra. And the number I actually care about: the two hosts agree to within 0.2 ms from the same source file. The parity claim survives being measured under load.
If a library only tells you its winning numbers, it’s an ad. Full table: performance page.
Three gotchas so you don’t find them the hard way
- The API-key env chain prefers OPENAI_API_KEY for openai-style clients. If that's set and you're calling OpenRouter, pass :api-key explicitly (as the demo does) — otherwise your OpenAI key goes to OpenRouter and you get a confusing 401.
- cljgo run evaluates top-level forms and doesn't call -main. Add a two-line entry file that requires the ns and calls it — cljgo-ex1's src/run_chat.cljc is exactly that — or build a binary.
- Write non-ASCII characters directly in source, not as \uXXXX surrogate escapes — the JVM reader assembles the pair, cljgo's doesn't. (Yes, we found that one the interesting way.)
Try it, break it, tell me
If you are a Clojure developer, you can use toolnexus today on the JVM and never think about any of the above:
{:deps {net.clojars.muthuishere/toolnexus {:mvn/version "0.13.0"}}}If you are curious whether Clojure-on-Go is real, clone the examples and run task cljgo-ex1. That is the same question I was asking, and running it is a better answer than anything I can write here.
- toolnexus — repo · docs, all seven languages · Clojars
- The examples in this article — clojure/examples
- cljgo — repo · Clojure hosted on Go
- koine — repo · the portability seam